Reports & Dashboards: Explained
Blog post description.
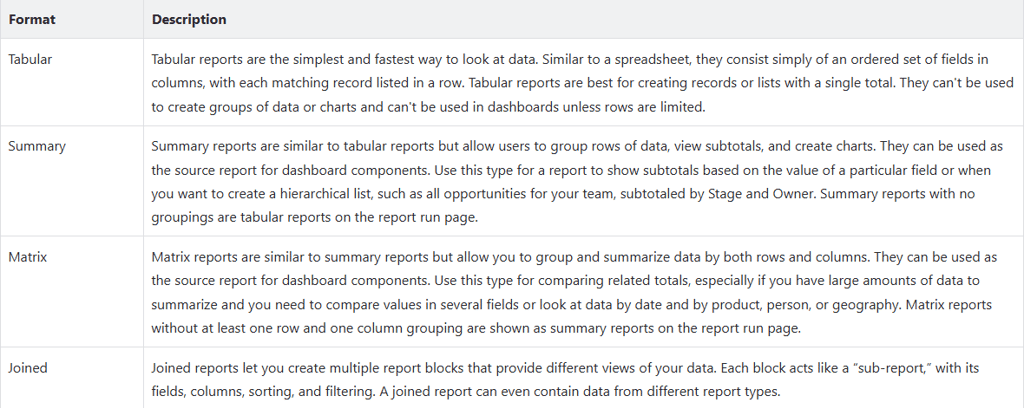
Tabular
Tabular reports are the simplest and fastest way to analyze data. Similar to a spreadsheet, they consist simply of an ordered set of fields in columns, with each matching record listed in a row. Tabular reports are best for creating lists of records or lists with a single grand total. They can't be used to create groups of data or charts and cannot be used in dashboards unless the rows are limited.
Summary
Summary reports are similar to tabular reports but also allow users to group rows of data, view subtotals, and create charts. They can be used as the source report for dashboard components. Use this type for a report to show subtotals based on the value of a particular field or when you want to create a hierarchical list, such as all opportunities for your team, subtotaled by Stage and Owner. Summary reports with no groupings show as tabular reports on the report run page.
Matrix
Matrix reports are similar to summary reports but allow you to group and summarize data by both rows and columns. They can be used as the source report for dashboard components. Use this type for comparing related totals, especially if you have large amounts of data to summarize and you need to compare values in several different fields, or you want to look at data by date and by product, person, or geography. Matrix reports without at least one row and one column grouping show as summary reports on the report run page.
Joined
Joined reports let you create multiple report blocks that provide different views of your data. Each block acts like a “sub-report,” with its own fields, columns, sorting, and filtering. A joined report can even contain data from different report types.
Report Formats
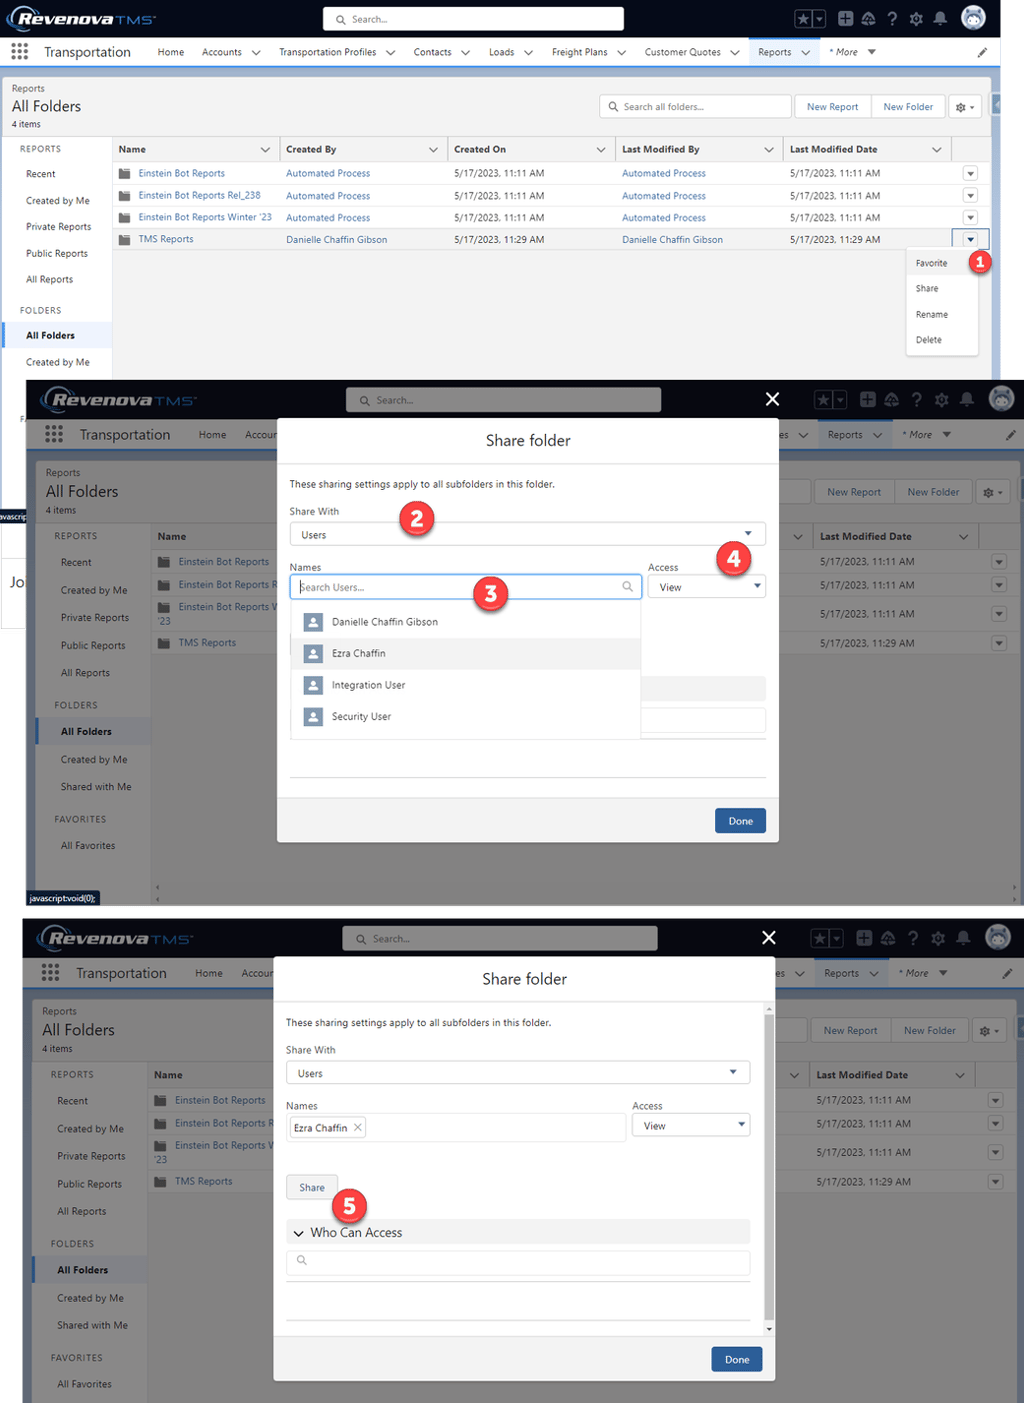
Share a Report or Dashboard Folder with an Individual User
Find the report or dashboard folder you want to share, click, and select Share.
From the Share With dropdown, select who you want to share with
For Name, enter the name you want to match. The name must match the category (such as user, group, or role). For example, if you select User as the category, specify a user's name.
Select the folder access level for the user, role, group, or territory.
Click Share. The sharing setting is applied to the Who Can Access list. Continue to add entries as needed. You can share with users, groups, roles, territories, or a combination. The most significant permission is granted if a user is identified in multiple entities. For example, a group is added with view only, but a user in the group is also added with edit or manage permissions. In this case, the edit or manage permissions apply to that user. To delete a Who Can Access entry, click X to the right of the entry. Select a new access level to modify an entry's access level.
When you’re done, click X in the upper corner of the dialog box to close it and return to the page you were on.
The folder is now available on the Folder(s) list for organizing your Lightning reports or dashboards.